


Amid slowing economic growth and the Federal Reserve tightening monetary policy to combat inflation levels not experienced since the early 1980s, many investors believe it is likely that the U.S. is on the cusp of entering an economic recession. Our analysis looks at how the S&P 500 Index has performed during each U.S. recession since the mid-1950s.
We use data from the National Bureau of Economic Research (NBER) to identify recessions. The NBER defines a recession as a significant decline in economic activity that is spread across the economy and lasts more than a few months. The committee that determines if an economic downturn classifies as a recession uses a range of criteria to determine its start and end dates, and often does not declare that the economy is in a recession until after it has already ended.
For this analysis, we looked at data going back to 1955. From 1955 to 2020 there were 10 recessions. We calculated the maximum drawdown for the S&P 500 Index during each recession. Maximum drawdown measures the peak to trough decline at the index level. Additionally, we calculated earnings degradation at the index level, as well as price-to-earnings multiple (P/E) compression at the index level during these periods to better understand the magnitude of earnings degradation and multiple compression.
U.S. Real GDP: Year-over-year change
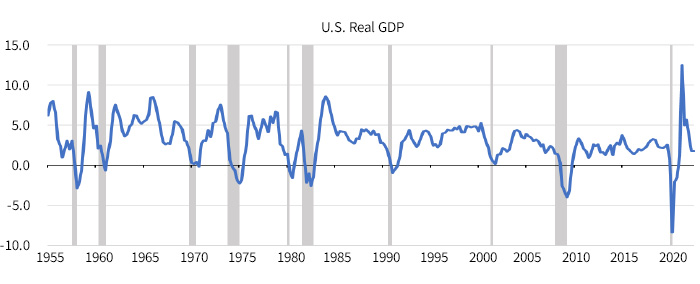
Sources: St. Louis Federal Reserve, NBER. Shaded areas indicate U.S. recession.
Earnings degradation, multiple compression, and S&P 500 drawdowns
The table below displays the magnitude of earnings degradation, multiple compression, and maximum drawdown for the S&P 500 Index in each of the previous 10 recessions.

Sources: Bloomberg, NBER.
On average, S&P 500 earnings decline 16.4% in recession. Notably in two of the last ten recessions, there was no decline in index earnings. In the 1973–1975 and 1980 recessions, earnings at the index level actually grew. Both of these periods had high and rising levels of inflation, which likely kept nominal earnings growing for large U.S. companies.
During the 1973–1975 recessionary period, EPS at the S&P 500 Index level increased 18.4%. During the 1980 recession, earnings increased 7.1%.
The average P/E compression was 26.0% and the S&P 500 Index multiple declined in each of the recessionary periods.
The average S&P 500 drawdown is 31.5%. The index entered a bear market (generally defined as at least a 20% peak to trough contraction) in seven of the ten periods.
Conclusion
During recessions, U.S. companies typically encounter sharp contraction in earnings, P/E multiples, and price. The last ten recessions each had drawdowns in the S&P 500 price level and P/E multiple, while earnings declined in eight of the ten recessions.
Looking at 2022, the trailing P/E ratio for the S&P 500 index has declined from a high on 12/31/21 of 24.7 to a low of 17.3 on 9/30/22; a decline of 30.0%. The max drawdown so far in 2022 (through the end of October) is 25.4%. Both approximating the sample averages.
Earnings per share growth is slowed, but it is still positive. We anticipate further earnings degradation in 2023. This is something to be mindful of as we enter 2023.
The S&P 500® Index is an unmanaged index of common stock performance.
You cannot invest directly in an index.
For informational purposes only. Not an investment recommendation.
This material is provided for limited purposes. It is not intended as an offer or solicitation for the purchase or sale of any financial instrument, or any Putnam product or strategy. References to specific asset classes and financial markets are for illustrative purposes only and are not intended to be, and should not be interpreted as, recommendations or investment advice. The opinions expressed in this article represent the current, good-faith views of the author(s) at the time of publication. The views are provided for informational purposes only and are subject to change. This material does not take into account any investor’s particular investment objectives, strategies, tax status, or investment horizon. Investors should consult a financial advisor for advice suited to their individual financial needs. Putnam Investments cannot guarantee the accuracy or completeness of any statements or data contained in the article. Predictions, opinions, and other information contained in this article are subject to change. Any forward-looking statements speak only as of the date they are made, and Putnam assumes no duty to update them. Forward-looking statements are subject to numerous assumptions, risks, and uncertainties. Actual results could differ materially from those anticipated. Past performance is not a guarantee of future results. As with any investment, there is a potential for profit as well as the possibility of loss.
Diversification does not guarantee a profit or ensure against loss. It is possible to lose money in a diversified portfolio.
Consider these risks before investing: International investing involves certain risks, such as currency fluctuations, economic instability, and political developments. Investments in small and/or midsize companies increase the risk of greater price fluctuations. Bond investments are subject to interest-rate risk, which means the prices of the fund’s bond investments are likely to fall if interest rates rise. Bond investments also are subject to credit risk, which is the risk that the issuer of the bond may default on payment of interest or principal. Interest-rate risk is generally greater for longer-term bonds, and credit risk is generally greater for below-investment-grade bonds, which may be considered speculative. Unlike bonds, funds that invest in bonds have ongoing fees and expenses. Lower-rated bonds may offer higher yields in return for more risk. Funds that invest in government securities are not guaranteed. Mortgage-backed securities are subject to prepayment risk. Commodities involve the risks of changes in market, political, regulatory, and natural conditions. You can lose money by investing in a mutual fund.
Putnam Retail Management.