


U.S. Convertible Securities

Strategy highlights
Inception date
July 31, 1993
Benchmark
ICE BofA U.S. Convertible Index
Total strategy assets†
$665.0M
(as of August 2023)
Investment vehicles
- Separate account
- U.S. mutual fund
- Convertible securities offer strong capital appreciation potential with contractually guaranteed income
- As a large part of the investment process, the team will use less efficient areas of the convertibles market to pursue performance
- The team is comprised of experienced managers providing analysis of both the equity and fixed income exposures that exist in convertibles. They are supported by Putnam's credit research team, which helps to identify opportunities in lower credit quality and unrated securities
*No assurance can be given that the investment objective will be achieved or that an investor will receive a return of all or part of his or her initial investment. Actual results could be materially different from the stated goals. Investors should carefully consider the risks involved before deciding to invest. As with any investment, there is a potential for profit as well as the possibility of loss.
†Assets may include accounts that are not reflected in the composite.
Investment team


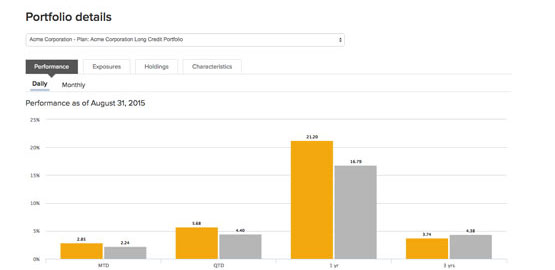
Performance
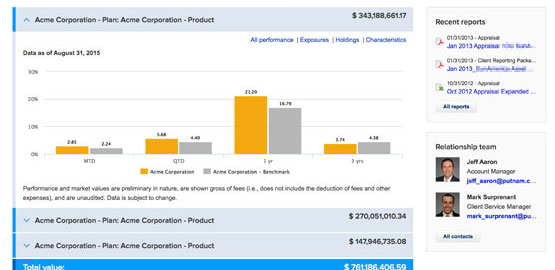
Annualized composite performance (%) as of August 31, 2023
| MTD | QTD | YTD | 1 Year | 3 Years | 5 Years | 10 Years | |
|---|---|---|---|---|---|---|---|
| U.S. Convertible Securities (gross) | -2.88% | -0.94% | 6.23% | 3.04% | 1.89% | 8.69% | 9.08% |
| U.S. Convertible Securities (net) | -2.93% | -1.04% | 5.79% | 2.40% | 1.26% | 8.01% | 8.39% |
| ICE BofA U.S. Convertible Index | -2.59% | 0.07% | 8.63% | 3.77% | 3.22% | 8.87% | 9.53% |
Calendar-year composite performance (%) as of August 31, 2023
| 2022 | 2021 | 2020 | 2019 | 2018 | 2017 | 2016 | 2015 | 2014 | 2013 | |
|---|---|---|---|---|---|---|---|---|---|---|
| U.S. Convertible Securities (gross) | -17.58% | 5.05% | 45.99% | 25.61% | -2.28% | 16.14% | 10.61% | -6.08% | 8.51% | 23.17% |
| U.S. Convertible Securities (net) | -18.09% | 4.40% | 45.08% | 24.83% | -2.89% | 15.41% | 9.92% | -6.67% | 7.82% | 22.37% |
| ICE BofA U.S. Convertible Index | -18.71% | 6.34% | 46.22% | 23.15% | 0.15% | 13.70% | 10.43% | -2.99% | 9.44% | 24.92% |
Past performance is not a guarantee of future results. An investment in this strategy could lose value. Most recent month-end performance is preliminary. Returns are subject to change.
Periods less than one year are not annualized. Performance is stated in U.S. dollars and includes the reinvestment of dividends and interest.
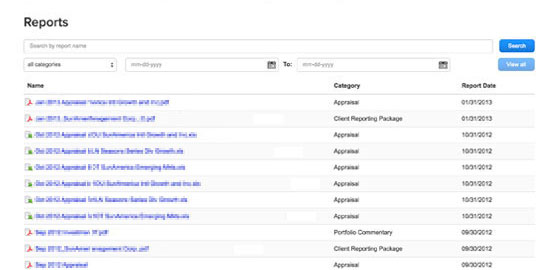
Literature
Related topics |
|---|
| Improving diversification with convertible bonds |
| Convertible and high-yield opportunities |
| The past, present, and future of bond markets |
Educational series on the convertible market |
|---|
| The basics of convertible securities (pdf) |
| The convertible bond market (pdf) |
| The behavior of the convertible market (pdf) |
| Convertibles as a structural allocation in a multi-asset portfolio (pdf) |
Strategy |
|---|
| Strategy profile |
Important disclosures
The Putnam Investments U.S. Convertible Securities Composite (the "Composite") seeks above-average total returns through an actively managed, broadly diversified significantly U.S. portfolio. The strategy seeks current income and capital appreciation with conservation of capital as a secondary objective. Accounts in the Composite will invest mainly in U.S. convertible securities and may invest in all sectors of the convertible securities universe, including convertible bonds and convertible preferred stock, as well as other security types including, but not limited to, corporate bonds and common stock. The strategy utilizes specialized analysis on all sectors of the convertible universe combined with risk-controlled portfolio construction. Derivatives, including futures, options, warrants, and swaps, may be used for hedging or non-hedging purposes. The composite's benchmark is the ICE BofA U.S. Convertible Index. The Composite comprises all fully discretionary accounts, including carve-out assets, managed by Putnam Investments in this investment style. A "carve-out" is a portion of a portfolio that is by itself representative of a distinct investment strategy. It is used to create a track record for a narrower mandate from a multiple-strategy portfolio managed to a broader mandate. The Composite may contain accounts with different but largely similar benchmarks. The Composite inception date was July 31, 1993. The Composite creation date was July 22, 2004.
The ICE BofA U.S. Convertible Index tracks the performance of publicly issued U.S. dollar denominated convertible securities of U.S. companies.
Gross performance includes the deduction of transaction costs but does not include the deduction of management fees and other expenses that may be incurred in managing an investment account. A portfolio's return will be reduced by advisory and other fees. Net performance reflects the deduction of a model fee applied on a monthly basis, equal to the actual management fee incurred by a portfolio in the Composite or the highest management fee that would be charged to a prospect of the strategy, whichever is higher. The model fee may change over time. Actual advisory fees may vary among clients with the same investment strategy. The Composite includes all actual, fully discretionary accounts with substantially similar investment policies and objectives managed to the Composite's investment strategy. Benchmarks are generally taken from published sources and may have different calculation methodologies, pricing times, and/or foreign-exchange sources from the Composite. The effect of those differences is generally deemed to be immaterial. The securities holdings of the Composite strategy may differ materially from those of the index used for comparative purposes.